Is an Ice Cream Truck Profitability? A Straight Answer
A truck can ring up a strong afternoon and still finish the day in the red. Three costs decide whether the revenue sticks: how much a day of stops actually earns, how often the freezer compressor runs, and what each stop costs in fuel. Gross sales on their own tell you none of it.
Daily route math is the profit-and-loss equation for one day’s stops: units sold per stop, times margin per unit, measured against the hours and miles the route consumes.
Freezer duty cycle is the share of operating time the compressor runs to hold product at temperature, which sets your daily power draw and your real cooling cost.
Fuel cost per stop is total fuel burned on a route divided by the number of stops served, and it shows how much of each stop’s margin disappears in driving and idling.
Here is how each one works, in order:
- Daily route math – how to build a stop list that covers cost before it earns profit.
- Freezer duty cycle – how compressor run-time and insulation choices move your daily overhead.
- Fuel cost per stop – how route density and idling behavior set your true cost per sale.
Each section sticks to plain numbers: formulas you can plug your own figures into, benchmarks to compare against, and the trade-offs that separate a profitable truck from a busy one. Fuel is often the easiest of the three costs to overlook, so it helps to understand how truck payload and efficiency interact before you blame sales volume.
Route density alone can split two identical trucks. Two trucks can sell the same number of units and post very different profits. One runs a tight loop with short gaps between stops. The other drives long, sparse hops and idles at curbs. The second burns more fuel per stop, and that difference lands on the bottom line. The same logic applies to the freezer: a well-insulated box cycles its compressor less often and costs less to cool, and every hour of reduced run-time is money kept.
Treat the three as a system. Improve route density and fuel cost per stop falls. Improve insulation and the duty cycle falls. Improve both and daily route math improves on its own. The goal is a model you can run before you buy a truck and refine after every route you drive.
Daily Route Math: The Foundation of Profitability
The question that decides everything is how many stops you can realistically serve in a day and what each one brings in. That is daily route math.
Start with total daily stops. A well-planned route through a dense suburban neighborhood might let you hit 40 stops in an afternoon. Multiply that by your average ticket per stop – the amount the typical customer spends. If your average ticket is $4.50, then 40 stops x $4.50 = $180 in gross daily revenue. Bump the average ticket to $6.00 with combo deals and premium items, and the same 40 stops produce 40 x $6.00 = $240. Same truck, same route, 33% more revenue.
Stop counts do not appear on their own. Route density decides them. Ten stops packed into three city blocks take far less time than ten stops scattered across five miles of country roads. Every extra minute between stops burns fuel and freezer power without selling a scoop – the kind of economic pressure that squeezes truck-based businesses. Lose 15 minutes to backtracking and you have missed roughly three or four stops: 3 x $4.50 = $13.50 gone before you notice.
Weather moves the numbers too. A hot July Saturday might support 50-plus stops; a chilly April Tuesday might justify 15. Operators who ignore the swing overbuild their routes and burn fuel for nothing. Keep a warm-weather plan and a cool-weather plan, then adjust week by week.
The $180 or $240 is only the top line. Subtract fuel, freezer duty-cycle costs, maintenance, permits, insurance, and your own time, and the picture changes. Understanding ice cream truck income means little until you know what is left underneath.
Daily Route Economics: How Route Length Reshapes Your Margin
Two trucks can sell the same number of cones and still take home different pay. The money leaks through three channels: compressor run-time, gallons burned between stops, and paid hours to finish the loop. A tight neighborhood route might cover 25 stops in a few hours; a cross-town haul strings 70 stops across a much larger area, and the extra windshield time eats into every dollar collected. As cost and fuel pressures continue to reshape small fleet operations, the daily math matters more than ever.
Longer routes add revenue but compress margin through fuel and duty-cycle costs.
| Line Item | Short Route | Medium Route | Long Route | Notes |
|---|---|---|---|---|
| Number of stops | 25 | 45 | 70 | Total selling points served per day |
| Average ticket | $12.00 | $12.00 | $11.50 | Revenue per stop; long routes dip slightly as drivers rush |
| Gross revenue | $300 | $540 | $805 | Stops x average ticket |
| Freezer energy cost | $16 | $36 | $64 | Duty cycle runs longer the more doors open and the engine idles |
| Fuel cost | $18 | $45 | $88 | Grows faster than revenue as drive time between stops increases |
| Labor | $55 | $100 | $150 | Driver pay plus prep and cleanup hours |
| Inventory/COGS | $90 | $160 | $240 | Product and packaging, roughly 30% of sales |
| Maintenance reserve | $12 | $26 | $42 | Per-mile set-aside for tires, brakes, and compressor service |
| Permits and insurance | $20 | $24 | $28 | Daily allocation of fixed compliance costs |
| Net profit | $89 | $149 | $193 | Gross revenue minus all costs |
| Net margin | 29.7% | 27.6% | 24.0% | Net profit divided by gross revenue |
What the Numbers Really Say
The long route brings in nearly three times the gross revenue of the short one ($805 versus $300), but its net margin is about six percentage points thinner. That gap is the fuel bill and the duty cycle. Every extra mile keeps the engine idling and the compressor cycling, so freezer energy and fuel take a larger share of each sale. The short route keeps stops close together, which means less windshield time and more margin per dollar collected.
The point is not to “avoid long routes” – the long route still delivers the highest absolute profit in this example ($193 per day versus $89). It means designing the route on purpose: cluster stops tightly, cut deadhead miles between neighborhoods, and account for the fuel and duty-cycle drag before you commit to a sprawling loop.
Revenue Per Stop and Daily Income Math
Revenue per stop is the money the truck collects at each location before fuel, product cost, and labor come out. The levers are the same for every operator, but how hard you can pull them differs: average ticket, the share of passing families who buy, and add-on sales such as a second item or a combo bundle.
A $9 average ticket and an 18% conversion rate cap a stop near $18 even with modest add-ons. Raise the ticket to $11, convert closer to 38% of passing families, and attach combos – a cone plus a drink, or a two-for-one pack – and the same stop can clear $78. That gap is attachment and timing, not luck.
The Breakdown Table Behind the Numbers
| Metric | Cautious | Steady | Optimized |
|---|---|---|---|
| Stops per day | 8 | 12 | 16 |
| Conversion rate (passing families) | 18% | 28% | 38% |
| Average ticket value | $9 | $10 | $11 |
| Add-on rate (second item or combo) | 10% | 22% | 35% |
| Revenue per stop | $18 | $42 | $78 |
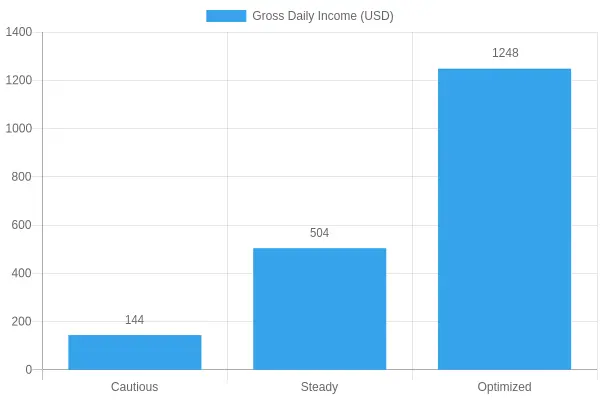
| Gross daily income | $144 | $504 | $1,248 |
Two Sample Daily Income Calculations
Calculation 1 (the cautious route): eight stops a day at $18 per stop is 8 x $18 = $144 gross daily income. Over a five-day week that is $720 – real money, but thin once fuel and product are paid.
Calculation 2 (the optimized route): a driver with more frequent, well-placed stops near schools, parks, and ball fields. At 16 stops generating $78 each, the same truck earns 16 x $78 = $1,248 in a single day. Stronger placement and attachment compound, because each stop feeds the next through word of mouth and repeat families.
Placement beats brute-force driving. Ten scattered stops with poor timing can underperform six stops scheduled for the hour families are out. As you build a denser, better-timed loop, revenue per stop and stops per day rise together, and your ice cream truck income grows faster than the hours you add. Following the economic forces shaping truck-based businesses helps you price and route on evidence instead of hope.
Freezer Duty Cycle: The Hidden Cost of Running an Ice Cream Truck
Fuel and payroll get most of the attention, but keeping a freezer safely cold all day carries its own cost. That cost is set almost entirely by the freezer duty cycle – the share of time the compressor actually runs. A 45% duty cycle means the compressor is off more than half the shift; 75% means it runs for three-quarters of your route. Same truck, same menu, very different bill.
What Moves the Duty Cycle
Three everyday forces push that percentage up or down:
- Ambient temperature. Every degree of summer heat forces the compressor to run longer to reject the same amount of heat. A freezer coasting at 45% on a mild 70°F morning can climb past 70% by a 100°F afternoon.
- Door-opening frequency. Each time you slide the serving window or reach for a tub, warm humid air floods the cabinet. High-volume stops with dozens of openings per hour can add 10-15 percentage points of runtime.
- Pre-cooling before departure. Pulling the freezer down to temperature overnight on shore power – instead of on the road – can shave the daytime duty cycle considerably, because the compressor starts the shift already ahead of the heat load.
From Duty Cycle to Kilowatts and Dollars
Translating the percentage into real money is simple arithmetic: Energy per day (kWh) = compressor power (kW) × duty cycle × hours running.
Say you run a 1.5 kW compressor at a 55% duty cycle over an 8-hour route. Your average draw is 1.5 × 0.55 = 0.825 kW. Over eight hours that is 0.825 × 8 = 6.6 kWh. At $0.15 per kWh, the freezer alone costs about $0.99 per day – roughly $300 across a 300-day selling season. Push the route to a hot-weather 75% duty cycle and the daily figure rises above $1.35.
| Ambient Temp | Duty Cycle | Freezer Energy (kWh/day) | Electricity Cost ($/day) |
|---|---|---|---|
| 70°F | 40% | 4.8 | 0.72 |
| 80°F | 50% | 6.0 | 0.90 |
| 90°F | 60% | 7.2 | 1.08 |
| 100°F | 72% | 8.6 | 1.30 |
Those numbers assume a $0.15 per kWh rate and an 8-hour shift on a 1.5 kW compressor.
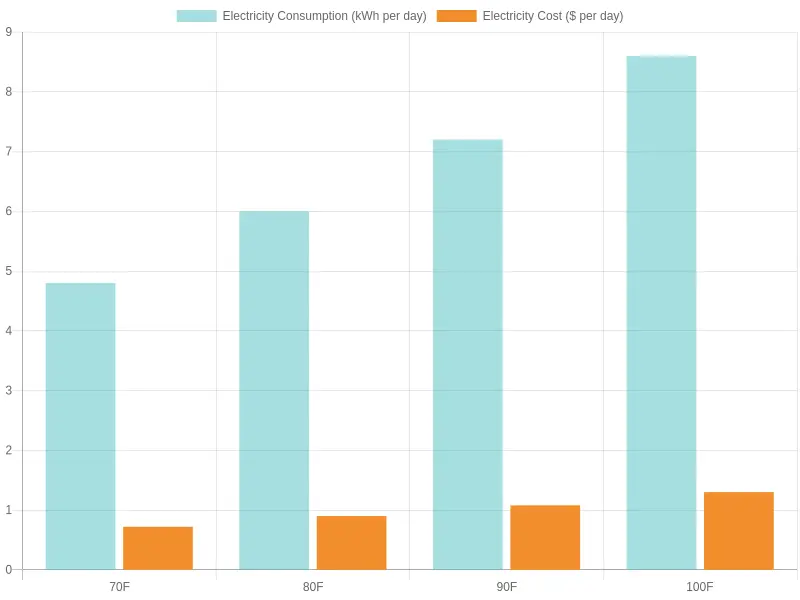
A dollar a day of ice cream truck electricity cost looks trivial. Across a season, poor pre-cooling habits and a leaky freezer door can still take hundreds of dollars off your margin, which is exactly why duty cycle deserves a line in your route math. As the industry examines the shift to electric power in commercial fleets, managing that load intelligently will only matter more.

The duty cycle is a thermostat cycling on a temperature band. The compressor kicks ON and pulls the cabinet down toward the target, then switches OFF and lets the interior drift back up to the upper threshold. Stay inside the band and the ice cream stays firm while engine load stays manageable. A wider band and better insulation mean less compressor run-time, which is how you trim fuel use per stop.
Fuel Cost Per Stop: Turning Miles Into Margin
For an ice cream truck, fuel comes in two forms. Every dollar at the pump splits into driving fuel (moving between neighborhoods) and idling fuel (keeping the engine running to power the freezer while you serve). Knowing the split is the difference between guessing at margins and managing them.
The core formula is simple:
Fuel cost per stop = (driving gallons + idling gallons) x local fuel price / number of stops served
Driving gallons come from route distance divided by vehicle MPG. Idling gallons come from idle time multiplied by your idle consumption rate – a typical gas-powered freezer truck burns roughly 0.5 gallons per hour while parked and serving.
A Fully Worked Example
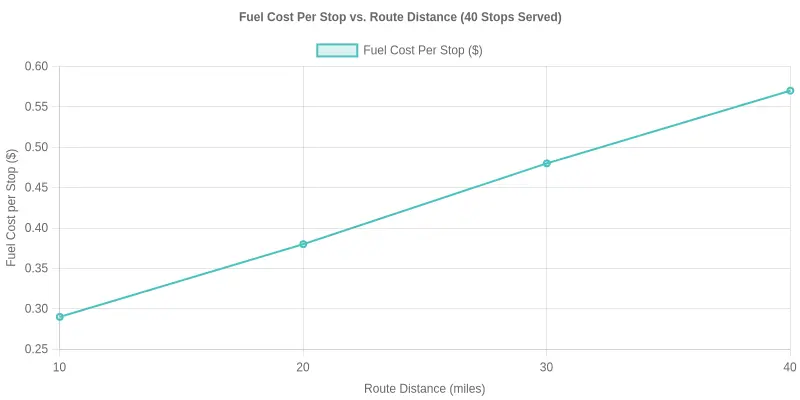
Imagine a 30-mile route at 10 MPG with fuel at $3.80 per gallon, serving 40 stops with about six minutes of idling at each.
- Driving fuel: 30 miles / 10 MPG = 3.0 gallons, or $11.40
- Idling fuel: 40 stops x 6 minutes = 240 minutes (4 hours) x 0.5 gal/hr = 2.0 gallons, or $7.60
- Total fuel: 5.0 gallons = $19.00
- Fuel cost per stop: $19.00 / 40 = $0.48
That $0.48 is your true fuel cost per stop, and idling alone accounts for 40% of it – money spent without moving the truck an inch.
Why Stop Density Wins
Now change the route, not the effort. Serve the same 40 stops inside a 10-mile footprint: driving fuel drops to 1 gallon ($3.80) while idling stays near $7.60. Total falls to about $11.40, or just $0.29 per stop. Short distances between stops spread the same driving fuel across more sales, so fuel cost per stop drops even though the customer count does not.
The Bigger Picture
Fuel is one line in your ice cream truck operating cost, but it is the one routing controls most directly. Small per-stop savings compound quickly, so it pays to follow the economic challenges shaping fleet decisions across the industry. Every mile you trim turns into margin.
Break-Even Analysis: How Many Stops Before You Profit
Before the first scoop is sold, you need to know how many sales cover the day’s costs. That number is your ice cream truck break-even point – the stop count where revenue catches up to what you spent to be on the road. The base case below is a single truck on a single day; swap in your own figures.
Fixed vs. variable costs
Your costs come in two flavors:
- Fixed costs stay the same whether you sell one cone or two hundred. Think insurance, permits, the truck loan or lease, and depreciation. In our model these run about $120 per day.
- Variable costs rise with every stop and every sale. Here that means fuel ($1.50 per stop), freezer duty-cycle power, and the wholesale product itself, which we set at 30% of each ticket – plus about $0.10 per stop in cups, cones, and napkins.
The difference between your average ticket and your variable cost per stop is your contribution margin – the money each stop hands toward covering fixed costs.
Crunching the base case
With an average ticket of $8.00, the math looks like this:
| Item | Amount |
|---|---|
| Average ticket | $8.00 |
| Product cost (30%) | -$2.40 |
| Fuel per stop | -$1.50 |
| Supplies per stop | -$0.10 |
| Contribution margin per stop | $4.00 |
Break-even stops = $120 / $4.00 = 30 stops per day.
That is the number that matters: make fewer than 30 stops and you are paying to drive. Every stop past 30 drops $4.00 straight to the bottom line.
How small changes move the line
Small changes move the line. Raise the average ticket from $8 to $9 and contribution margin climbs to $4.70, cutting break-even to about 26 stops. Drop the ticket to $7 and it rises to 36 stops. Fuel sits inside the contribution margin, so a jump from $1.50 to $2.25 per stop pushes break-even to about 37 stops – a bigger move than shaving 75 cents off the ticket, because product cost falls along with the price. Many operators feel this in operating cost volatility long before they see it in the till.
Protect the margin. Route efficiency, a slightly higher ticket, and less idling all pull your break-even point down, and that is the fastest path from a busy route to a profitable one.
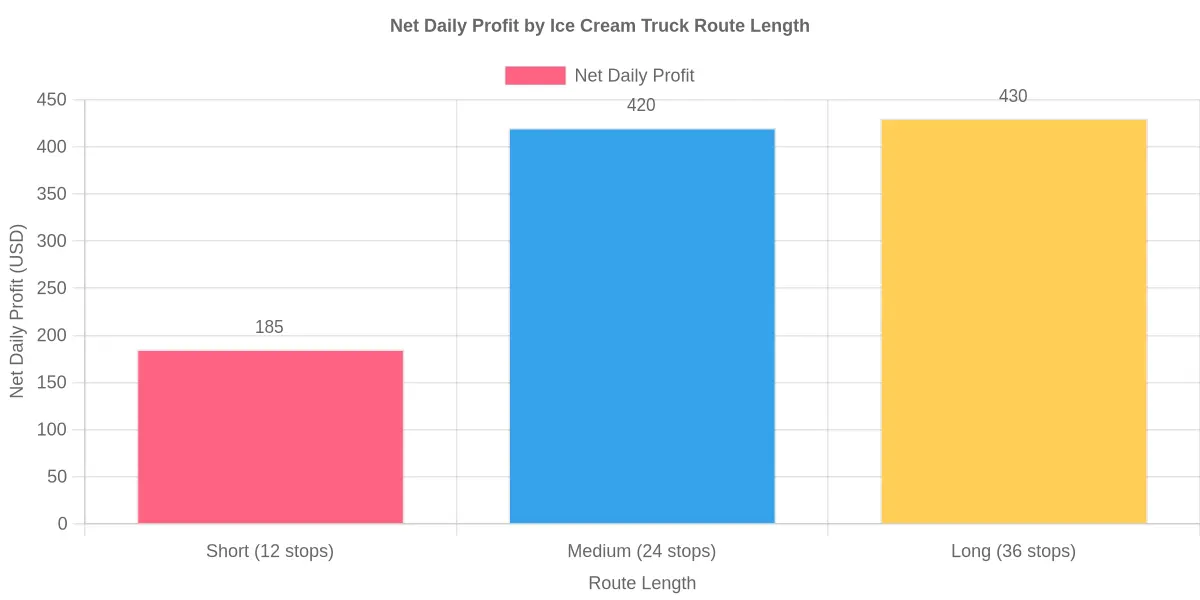
Stretching a route from the 12-stop short loop to the 24-stop medium loop roughly doubles net daily profit, from about $185 to $420. Push on to the 36-stop long route and the curve flattens, adding only about $10 for twelve more stops. Diminishing returns land around 24 to 30 stops, where the freezer duty cycle, drive time, and fuel cost per stop start eating the margin each new customer was supposed to bring. The fix is less about adding stops than about routing for higher margin and lower energy use, keeping your fuel and payload costs under control as the loop grows.
Frequently Asked Questions About Ice Cream Truck Profitability
How Much Can an Ice Cream Truck Make Per Day?
A well-run ice cream truck on a dense summer route typically grosses $400 to $800 per day, with net profit (after fuel, product, and maintenance) landing between $150 and $450. Route density matters more than chasing scattered events: trucks hitting 80-120 stops a day convert more sales per mile than those driving between one-off locations. On peak weekends or holidays, gross revenue can climb past $1,000, while slow weekdays may fall below $200. Your real net depends on controlling the three big variable costs: product, fuel, and freezer power.
Is an Ice Cream Truck Profitable in Winter?
In most North American markets, a standard ice cream truck is not profitable in winter, as demand drops 50-70% once temperatures fall below 60°F. Operators who stay solvent usually pivot to hot drinks, baked goods, or indoor events between November and March. Others park the truck and cut fixed costs to near zero, treating summer as a seasonal income window. Running the same cold-menu route year-round in a cold climate usually just burns cash.
How Does Freezer Duty Cycle Affect Profit?
The freezer compressor cycles on and off to hold temperature, and that duty cycle is the largest hidden cost on an ice cream truck. A unit running a 40-60% duty cycle draws one to two kilowatts while running, powered either by the engine or a battery bank. A freezer stuck near 100%, often from worn door seals or overloaded stock, can add about a dollar a day in energy – several hundred over a season – and wears the compressor out faster. Servicing the freezer and pre-chilling product keeps the duty cycle low and margin high.
What Is a Good Fuel Cost Per Stop?
A healthy target is $0.50 to $1.00 in fuel per stop, or roughly 5-10% of revenue at each stop. Anything above $1.50 per stop usually signals a route that is too spread out or too much idling at each location. Fuel-efficient and electric options are worth watching here, with zero-emission truck innovations starting to reshape how operators think about powering refrigeration. Dense routes with short hops between stops are the cheapest to run.
Do You Need a Commissary to Operate?
In most U.S. states and Canadian provinces, yes, a licensed commissary or approved base of operation is required for a mobile food business, including ice cream trucks. You typically need it for potable water, wastewater disposal, cleaning, and food storage between shifts. Some jurisdictions allow a private garage that passes inspection instead of a commercial commissary. Confirm local health department rules early, because noncompliance can shut your route down entirely.
How Do You Increase Profit Per Stop?
Profit per stop grows through upselling, menu engineering, and better route density. Bundling a premium item with a standard cone, or offering a $5 combo, can lift average ticket size 15-25% without adding a single stop. Cutting low-margin items and stocking popular high-margin treats means more profit from the same freezer space. Finally, clustering stops closer together lowers fuel and time per sale, compounding the gains across the whole route.
The Bottom Line on Ice Cream Truck Profitability
Profitable ice cream routes are built, not discovered. In a mobile vending operation, the margin traces back to three levers you control: daily route math, freezer duty cycle, and fuel cost per stop.
Daily route math sets the ceiling. Once you know your average ticket, stops per hour, and hours per shift, you can forecast a day’s revenue before the truck ever leaves the depot. Freezer duty cycle protects product margin: a compressor that runs longer than it needs to eats the profit from every bar sold, while an efficient cycle keeps spoilage and energy draw in check. Fuel cost per stop ties the route together – too many miles between customers turns a full cash box into a thin one. All three respond directly to your decisions, much as operating cost pressures shape profitability across the broader trucking industry. Location and luck adjust the inputs, but they are not the formula.
Start with measurement, not more marketing. Track profit per stop before anything else. It is the metric that tells you whether route density, pricing, and cold-chain efficiency are working together, and it improves fastest when you fix the weakest of the three. Set a target, log it daily, and adjust one variable at a time.
Treat the truck like a P&L on wheels, watch profit per stop, and profitability stops being a gamble and becomes a result.