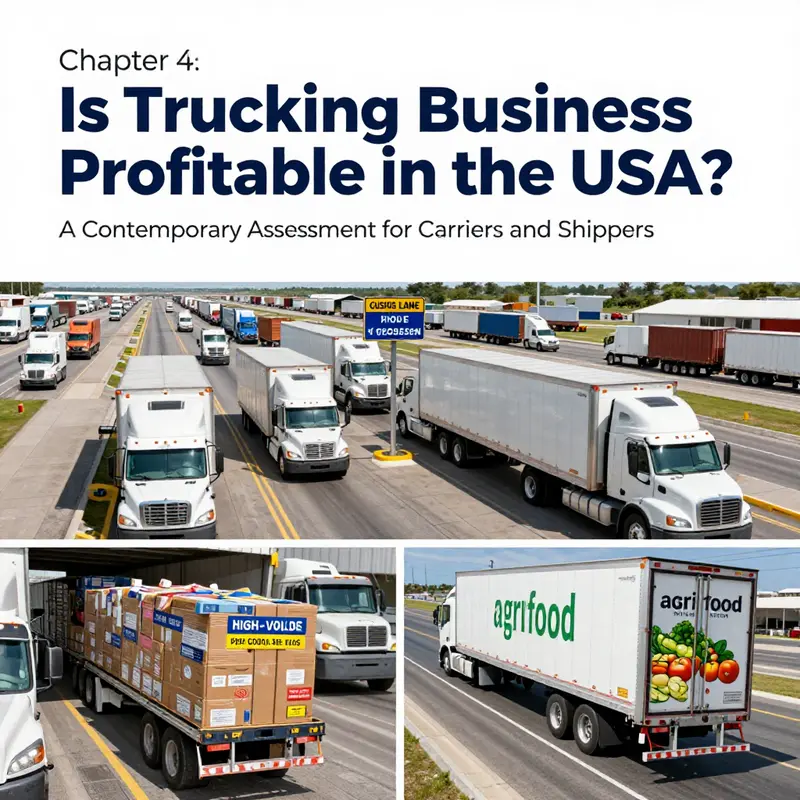
Profitability in U.S. trucking is no longer a given. Recent industry data and market assessments describe a profitless recovery: freight volumes have recovered in pockets, yet rates frequently fail to cover true operating costs once empty miles, equipment finance, and regulatory overhead are counted. For logistics and freight companies, construction and engineering firms that depend on reliable haulage, fleet managers charged with cost control, and food & beverage distributors bound by tight margins and delivery windows, this reality requires clarity and practical response. Chapter 1 frames current profitability trends across the sector and why many carriers remain underwater. Chapter 2 quantifies price and cost dynamics — spot rates, empty miles, and break-even calculations — to show where losses occur. Chapter 3 examines structural drivers — capacity contraction, tariffs, and market imbalance — that have reshaped margins. Chapter 4 highlights regional and segment variations, with attention to Mexico cross-border trade and niche high-margin freight that provide outsize support. Chapter 5 outlines strategic adaptations used by large players to protect margins and practical actions mid‑sized fleets and shippers can adopt to improve outcomes. The following analysis synthesizes market data and actionable approaches to help decision-makers assess risk, design mitigation, and restore sustainable returns.
Chapter 1: The Profit Puzzle in U.S. Trucking — Navigating Tight Margins, Shifting Demand, and Hidden Strengths
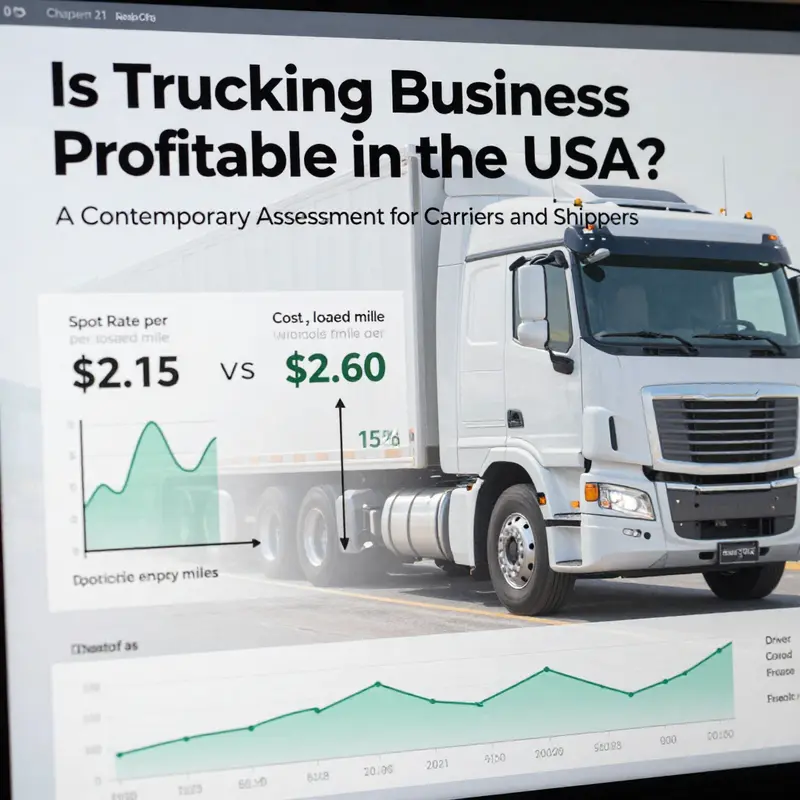
Profitability in the U.S. trucking industry has become a problem of matching worthwhile returns to a costly and variable operating environment. The latest signal is a hard one: for many operators, freight rates barely cover the true cost of moving a load, and the margin for error is shrinking. Analysts describe the current period as a profitless recovery, where the typical mile, loaded or empty, must absorb a long list of fixed and semi-fixed costs that do not fall as quickly as prices during slower cycles. In practical terms, even full trucks can operate with little more than unit-cost coverage when the mix of loaded and empty miles is calculated in. The fundamental arithmetic is clear in the most widely cited numbers: spot rates around two dollars per loaded mile may look sturdy on the surface, but when you add a proportion of empty miles—often in the neighborhood of 15 percent or more—the effective cost per loaded mile approaches two and a half dollars. That small delta is the difference between a marginal profit and a loss from the same asset if demand softens or capacity tightens against a spike in volumes. The reality is not a simple cyclic downturn but a structural rebalancing that has left many fleets too lean to survive without adjusting hedges, routes, or service models. The industry is being forced to reexamine what constitutes productive utilization, what constitutes an acceptable return on investment, and how to sustain operations when the odds often favor the buyer rather than the seller of capacity. The nuances are many, but the central thread remains consistent: profitability today is a function of precise cost management, selective pricing power, and a clear alignment of service design with customer value.
The macro backdrop helps explain why pockets of stability exist even as the broader picture remains challenging. The sector has faced a severe capacity contraction over the past several years. A meaningful share of operators exited the market, and orders for new tractors and trailers stayed historically low. Tariffs, once thought to promise a boost to domestic manufacturing and, by extension, freight demand, did not deliver the expected benefits. Instead, the combination of policy uncertainty and a slower-than-anticipated rebound in production activity served to dampen overall freight demand. The result is a market that feels tighter on the upside and looser on the downside, with demand spikes producing pronounced competitive pressure rather than a well-anchored pricing uplift. The imbalance amplifies the volatility that carriers face and makes it difficult to achieve predictable profitability across the calendar.
Yet not all regions or segments move in lockstep with the same rhythm. One bright thread is the stability provided by cross-border trade with Mexico. Despite a broader softness, the U.S.-Mexico freight corridor has remained a reliable source of steady demand, contributing to a floor beneath activity levels and helping stabilize utilization in certain lanes. This cross-border dynamic illustrates how a globalized logistics network can create resilience by diversifying exposure to domestic demand cycles. It is a reminder that profitability in trucking is not only about domestic demand growth but also about how fleets integrate different streams of work and adjust capacity to shifting freight flows. As seen in industry analyses and the open data that underpins them, the picture is not uniform across all carriers; it is nuanced and contingent on strategic choices about lanes, customers, and asset mix. A carrier that leans into high-margin, value-added offerings—such as precision logistics for time-sensitive or hazardous materials—may find a more favorable margin trajectory than one whose model relies on high-volume, low-margin general freight.
Within this landscape, the tank trucking subsector stands out as a significant anchor in the revenue structure of the broader market. Petroleum products have long been a core driver of tank operations, and recent market analyses place their share of 2024 revenue at about 47 percent. This concentration underscores the central role of energy markets in shaping the profitability profile of tank fleets. Tank transport benefits from relatively stable demand tied to refinery throughput, distribution networks, and the essential nature of refined fuels for transportation and heating. Yet stability does not translate into automatic profitability. Tank carriers face safety and regulatory requirements that elevate compliance costs, while the specialized handling, spill response readiness, and insurance needs add expense ballast. When price dynamics in refining, feedstock costs, and product flows shift, margins can compress quickly if pricing does not keep pace with these cost pressures. Nonetheless, the concentration of revenue in petroleum products also means that a well-managed tank operation can achieve a higher degree of revenue predictability than some general freight segments, where demand is more sensitive to cyclical factors and competitive intensity.
To read the profitability signals with nuance, it helps to look beyond segment-level abstractions and examine the core cost structure that governs every carrier’s bottom line. Labor remains the largest single expense for most fleets, driven by driver wages, turnover, and recruiting costs in a tight labor market. The driver shortage compounds the cost problem: when qualified drivers are scarce, payroll costs rise, scheduling becomes more complex, and service levels can degrade if capacity is stretched. Fuel, always a major variable, interacts with routing decisions, load optimization, and vehicle efficiency. While many operators pursue hedging strategies and fuel-efficient equipment to dampen this volatility, hedges cannot eliminate exposure entirely, and fuel remains a dependable lever for margin discipline when managed well. Insurance and compliance add a permanent layer of cost pressure, intensified by stricter safety standards, ELD mandates, and evolving regulatory requirements. Even with favorable technological uptake—telematics, predictive maintenance, and route optimization—the sunk costs associated with modernizing fleets and maintaining safety regimes can weigh on near-term profitability, especially for smaller operators with tighter balance sheets.
The financial tailwinds that support profitability tend to cluster around efficiency and differentiation. Fleet utilization—achieving high load factors with minimal idle time—moves the needle on a cost-per-mile basis. Asset precision, such as modern telematics, allows better maintenance scheduling and a lower probability of breakdowns, which has a direct bearing on reliability and customer satisfaction. When a carrier can pair high utilization with premium service offerings—such as on-time delivery guarantees, safe handling of sensitive cargo, or consolidated logistics services—the pricing power can improve, turning what was once a price-driven market into a service-driven value proposition. Diversification also matters. Carriers that broaden their portfolios to include refrigerated, flatbed, or multi-mode capabilities can smooth revenue streams across cycles. The broader narrative here is that technology-enabled differentiation is not a luxury but a risk-management practice that helps stabilize profitability in a volatile market.
Of course, the negative forces are persistent, and they shape the strategic choices carriers must make. The industry’s profitability is highly sensitive to fuel volatility, interest rates, and the macro demand cycle. The cost of capital for equipment, especially in an environment of tighter financing conditions, pressures returns on new asset investments. The regulatory environment exerts ongoing pressure through compliance costs, hours-of-service constraints, and safety requirements that expand the cost base without a guaranteed offset in price. At the same time, supply-chain volatility—from port backlogs to fluctuating demand in manufacturing—further complicates demand forecasting and raises the risk of underutilized capacity in some lanes. Against this backdrop, success hinges on a carrier’s ability to pair disciplined cost management with a well-structured demand strategy. The alignment of customer segments, service levels, and asset utilization becomes not just a competitive advantage but a necessity for surviving a period when rate increases may not keep pace with rising expenses.
Looking ahead, the profitability outlook for U.S. trucking is unlikely to resemble a simple rebound. It will likely unfold as a mosaic of outcomes, with some carriers carving out steadier margins through niche specialization, integrated logistics, and careful lane selection, while others grapple with persistent cost pressures. An evidence-based approach to strategy—grounded in open data from transportation statistics, fuel price trends, and regulator-led cost considerations—will help operators differentiate between a temporary squeeze and a structural shift. Public data sources from trade associations and government agencies, alongside open-access market analyses, provide a foundation for more transparent modeling of margins and capacity dynamics. Integrated insights from these sources inform not only tactical decisions—like route optimization and hedging strategies—but also longer-term decisions about capital investment, workforce development, and service design. For readers seeking to extend this discussion with additional data, one can turn to comprehensive market analyses that detail segment shares, growth trajectories, and margin context in the tank trucking space, as well as to industry repositories that track utilization, accidents, and regulatory costs. In particular, market analyses that quantify the share of revenue attributable to petroleum products illuminate why this sub-sector often serves as a stabilizing force for overall profitability even when broader freight markets wobble. As the industry continues to evolve in response to demand shifts, policy signals, and technology, the chance to reimagine profitable models remains real, provided operators embrace disciplined cost control, selective pricing power, and disciplined asset management.
Internal link for further perspective on policy and cross-border considerations can be found in discussions about navigating cross-border challenges in trucking, which highlight how regulatory and logistical nuances across borders influence profitability and operations. For readers who want to explore that lens, the linked exploration offers a close look at how policy, trade, and geography shape day-to-day freight decisions.
External reading that complements this overview includes market-focused analyses of the tank trucking segment, which provide deeper context on the revenue share and margin dynamics within petroleum product transport. Such sources help illuminate why the tank niche can contribute more predictable margins than other segments, while also clarifying the cost pressures that accompany safety, compliance, and specialized handling. For those seeking the most up-to-date public data on this topic, a comprehensive industry analysis published by a leading market research firm offers additional context on growth trends, competitive dynamics, and capital planning considerations for tank trucking within the U.S. freight ecosystem. See in particular the sector-wide discussion of tank trucking revenue drivers and the role of refinery activity in shaping demand and pricing power.
In sum, profitability in U.S. trucking today is less about universal gains and more about strategic optimization. It demands a clear view of costs, a disciplined approach to utilization, and the willingness to pursue higher-value freight where margins justify the effort. While the larger market faces headwinds from policy uncertainty and capacity shifts, there is space for profit through specialization, effective hedging, and data-informed decision making. For operators who can align asset strategies with customer needs and navigate the complex mix of fuel, labor, and compliance costs, the road ahead remains navigable even if the overall terrain remains challenging. The story of profitability in trucking is not a single verdict but an ongoing assessment of how well a carrier converts risk into resilience, and resilience into durable returns.
Open-access data and ongoing analyses from public sources offer a practical trail for readers who want to ground these observations in verifiable trends. For a broader, industry-wide perspective on the tank trucking segment and its revenue dynamics, consider exploring the linked market analysis and related data sets that discuss sector shares and growth forecasts. This context helps illuminate how profitability can be pursued even when the average carrier struggles, by focusing on within-segment margins, differentiated service, and disciplined capital deployment.
Internal link reference: navigational insights on cross-border challenges and policy effects can be explored here: https://titanbusinesstrucks.com/navigating-cross-border-challenges-key-insights-from-the-tca-annual-meeting/
External resource for further reading: https://www.grandviewresearch.com/industry-analysis/us-tank-trucking-market
Chapter 2: On the Profit Line — Price and Cost Dynamics in U.S. Trucking: Spot Rates, Operating Costs, and Break-even Realities
Profit in the U.S. trucking sector is determined by a narrow, ever-shifting equation: the price at which freight moves versus the cost of moving it. This is not simply a matter of bidding higher or chasing larger volumes; it is a constant balancing act between real-time spot market pricing, long-term contract structures, and a mosaic of operating expenses that can swing with the weather, fuel markets, and policy shifts. When the economy hums and capacity tightens, rates can buoy margins. When demand wobbles or fleets shed capacity, costs stay stubbornly fixed in many cases, and the margin tilts toward negative. In this environment, profitability is not a given even for operators who run strong, full days. The chapter on price and cost dynamics asks not just what carriers earn, but what they can keep after the fuel pump, insurance broker, maintenance shop, and the daily drumbeat of compliance and dispatch fees have taken their share. That drumbeat is relentless, and it shapes every strategic decision a fleet makes, from route selection to fuel efficiency investments to the way it staffs a shop floor of drivers and technicians.
Two decades of pricing history have left a clear imprint on earnings. Early in 2024, spot freight rates for dry van freight averaged around $3.80 per mile nationally, with wide regional variation and meaningful differences by commodity and lane. Those spot numbers are the battlefield where a lot of small fleets and owner-operators fight for a living—their reliability and responsiveness can win them loads that a larger carrier might overlook, especially when time windows tighten. The volatility of those rates is not a rumor; it is a built-in feature of a market where capacity, demand, and the revenue per mile can swing with the barometric pressure of a global economy. If you pry beneath the headline rate, you will find the quiet truth: spot pricing is the most dynamic piece of the profitability puzzle, and it often carries the most risk for operators who lack diversified revenue streams or contracts that smooth the peaks and troughs.
The flip side of the pricing coin is the cost side, and in trucking, costs are both visible and persistent. Fuel is the most conspicuous line item, typically accounting for roughly a quarter to nearly a third of total operating costs. Fuel price swings can erase expected profits in a matter of days, as demonstrated when diesel spiked in 2022 and many small operators watched margins vanish under the weight of higher fuel bills. Beyond fuel, insurers have pushed premiums higher in recent years due to rising claims and risk exposure, lifting annual truck insurance toward the high end of the budget. Maintenance and repairs follow a steady drumbeat of wear and tear, with routine upkeep and unexpected breakdowns charging a steady toll on the P&L. Depreciation, too, is a real expense that can become immediately visible when a fleet must replace equipment sooner than planned due to environmental or regulatory pressures or when a used asset loses value faster than anticipated. When you stack these costs together, the baseline reality becomes stark: even when a rig runs clean and full, the total costs can press hard against revenue, especially for operators who rely heavily on spot market work without an ample spread between paid miles and empty miles.
To translate this into a working benchmark, many voices in the industry point to a commonly cited break-even range that reflects the income needed just to cover every cost and leave a modest profit. In the context of a typical full-size semi-truck, that break-even threshold has often fallen in the vicinity of roughly $4.50 to $5.00 per mile, depending on the mix of equipment, geography, and load type. It is a sobering yardstick: if spot rates fail to meet or exceed that level, a fleet must depend on higher utilization, better contract economics, or a favorable mix of freight to preserve viability. The equation becomes more complex when you factor in overhead. Offices, dispatch software, credit management, vehicle financing, and the administrative time required to keep loads moving all add to the per-mile cost base. In an industry where a truck’s daily rhythm is a long sequence of loaded miles punctuated by empty miles, even small inefficiencies multiply across the week and quarter, muting any potential profitability.
Cost composition in trucking is not a static portrait. It shifts with policy, weather, and the macroeconomy. The interwoven effects of tariffs, regulatory costs, and environmental requirements can elevate the price of doing business in ways that are not immediately visible in a single line item. In recent history, tariffs and policy shifts have created a sense of headwind, particularly for sectors dependent on manufacturing and cross-border activity. When tariffs dampen demand or disrupt supply chains, freight volumes can shrink just as costs rise from another direction—through higher insurance or more stringent maintenance regimes designed to comply with evolving standards. The outcome is a more complicated landscape where even periods of tight capacity do not automatically translate into sustainable profitability if the underlying rate environment does not support the cost structure.
A crucial nuance in this discussion is the role of empty miles. While the industry often cites the efficiency of moving goods, empty miles are the hidden cost of misaligned capacity and network planning. In markets with severe capacity contraction, the industry may see fewer trucks available when demand spikes, which can temporarily push spot rates up. But when those spikes occur, operating costs also rise—especially if capacity shortages lead to longer detours, higher fuel burn, and misaligned equipment utilization. The consequence is a per-mile profitability puzzle that is not solved by a single tactic but requires a disciplined, data-driven approach to routing, utilization, and load selection. When you combine volatile spot rates with the structural costs of running a fleet—including insurance, maintenance, and driver wages—the margin becomes a moving target rather than a fixed advantage.
Within this framework, real-world operators have adapted in different ways. Some have pursued higher-margin, higher-value freight as a hedge against rate volatility. These operators seek lanes and customers that value reliability, speed, and service quality, accepting smaller, more predictable revenue streams in exchange for reduced risk. Others have tightened their cost structure through fuel-efficient equipment, better fuel management practices, and more precise maintenance scheduling. Yet, even with these improvements, the broader market message remains clear: profitability is not guaranteed by efficient driving alone. A disciplined approach to contract development, rate negotiation, and fleet planning is essential for turning the price-cost equation in a favorable direction over the course of a business cycle.
The current reality, as highlighted by recent market analyses, underscores a second, more sobering truth. The industry has entered a period often described as a profitless recovery. Spot rates in some segments have fallen back toward levels that barely cover operational costs, once you account for empty miles. In practical terms, a carrier could be moving a full load at a rate that seems adequate in isolation, yet when the miles traveled and the costs of empty trips are fully tallied, the operating margin can disappear. This reality reframes how investors, operators, and policymakers think about the trucking business. It shifts the emphasis from merely filling capacity to building resilience—through diversified revenue streams, disciplined capital expenditure, and a keen eye for the subtle, cumulative costs that can erode margin across the year.
To connect these threads to policy and practical strategy, it helps to consider how tariffs and regulatory risk fit into the cost structure. Acknowledging that the tariff landscape has not consistently produced the expected economic benefits, operators must still anticipate policy-driven cost changes. A useful practical step for fleets is to build flexibility into pricing and procurement, so that a sudden shift in fuel taxes, insurance requirements, or emission-related compliance costs does not overwhelm the operating margin. For fleets contemplating strategic shifts, there is value in exploring the flexibility of cross-border and multi-modal opportunities, where rate structures can be diversified and service offerings broadened. The cross-border dimension, in particular, can provide more stable demand in times when domestic freight markets tighten, serving as a counterbalance to regional volatility. And for operators seeking to learn from industry evolution rather than chase a single margin, there is merit in studying efforts that migrate toward higher-value freight and more predictable revenue streams rather than relying solely on high-volume, low-margin transport.
For readers who want to ground these ideas in concrete data, a practical takeaway is to compare annual and quarterly cost benchmarks with current spot rate indices. The American Trucking Associations Freight Index and Cost of Doing Business report remains a valuable reference point for understanding the evolving cost structure and the profitability threshold in different market conditions. By triangulating spot rate trends with fuel, insurance, and maintenance costs, a carrier can better forecast break-even scenarios under a range of demand conditions and make informed decisions about fleet composition, capacity, and pricing strategy. The broader market picture—where profitability is squeezed for many operators but supported in pockets by cross-border trade and selective freight segments—highlights the need for careful financial planning, risk management, and an adaptable business model.
In short, the price and cost dynamics of U.S. trucking reveal a landscape where margins are compressed by volatile spot rates and stubborn fixed costs, yet potential exists for those who can engineer a price structure that mirrors true value. The path to profitability in this environment is not guaranteed by efficiency alone; it requires a deliberate blend of strategic lane selection, contract diversification, and cost discipline. It also calls for a willingness to reframe the business around resilience—investing in people, processes, and partnerships that can weather a cycling market where the line between profit and loss can move with the price of fuel, the weight of insurance, and the pace of global demand. As the sector continues to adapt to policy changes, capacity shifts, and evolving trade patterns, the next chapters will illuminate how operations can translate these dynamics into sustainable performance, whether through technology-enabled efficiency, smarter load planning, or a broader view of value that extends beyond the quarter.
For readers seeking a deeper dive into the tariff and regulatory cost structures that shape these decisions, a concise exploration of how policy shifts influence trucking costs can be found here: tariffs and EPA regulations impact on trucking costs. And for those who want current, granular rate and cost benchmarks to benchmark against, the industry-standard reference remains the Freight Index from the American Trucking Associations, which provides ongoing, data-driven insight into the economics of moving goods across the country: https://ata.org/research-and-data/freight-index
null
null
Border Routes and Premium Niches: Where U.S. Trucking Still Finds Profit
The U.S. trucking industry is uneven. Across the country, carriers face a squeeze as costs rise and average freight rates lag. Yet profitability is not uniformly bleak. Regional corridors and specialized service lines show a clearer path to positive returns. This chapter explores how cross-border Mexico trade and niche high-margin freight produce better economics for some operators. It traces the practical reasons these segments outperform general freight. It also explains what carriers must do to shift toward more profitable activity.
Cross-border trucking between the U.S. and Mexico is one of the most tangible examples of a corridor that supports stronger margins. More than a million truckloads cross the southern border each year. Those flows concentrate demand along major border crossings and interior distribution hubs. That density creates scale for carriers that invest in specialized cross-border operations. They benefit from repeat business with manufacturers, logistics providers, and retail chains that rely on predictable transit times.
Profitability in cross-border lanes stems from several operational realities. First, customs and regulatory complexity adds value to experienced carriers. Shippers are willing to pay premiums for firms that manage documentation, bonded terminals, and customs broker relationships. Second, tight delivery windows tied to just-in-time manufacturing and e-commerce replenishment elevate the cost of failure. Carriers that can guarantee predictable transit and unloading times command higher prices. Third, border congestion and infrastructure bottlenecks raise the marginal cost of service. That cost becomes a pricing lever for carriers that mitigate delays through local knowledge, scheduling, or terminal capacity.
Carriers specializing in U.S.-Mexico lanes often arrange services differently than general freight firms. They tend to layer customs brokerage, cross-docking, and local drayage into bundled offerings. Those bundles reduce empty miles across the network and improve asset utilization. They also create recurring revenue streams, since many customers prefer integrated solutions over transactional spot moves. The structural advantage here is practical: when a single provider solves multiple friction points, that provider can capture margin across each step in the chain.
Not every carrier can access these benefits. The required investments are tangible. Bonded facilities and customs expertise take time and capital to build. Cross-border work also demands bilingual staff and robust compliance systems. Moreover, geopolitical shifts and trade policy changes can alter demand quickly. Still, for firms that commit, the revenue uplift tends to outpace the additional costs, producing margins well above industry averages.
Beyond cross-border flows, niche freight segments demonstrate consistent premium pricing. Sectors such as temperature-controlled transport, hazardous materials, oversized loads, and expedited deliveries carry higher unit rates. Those rates reflect an interplay of scarcity, regulation, and risk. Specialized equipment and trained drivers raise the barrier to entry. That scarcity then reduces pricing pressure and increases contract longevity.
Temperature-sensitive freight illustrates the point clearly. Perishable goods, pharmaceuticals, and certain chemicals demand strict temperature control and rapid response. The tolerance for service failure is low. A missed delivery or a refrigeration malfunction can destroy cargo value. Shippers recognize this risk and will pay for carriers that can document temperature integrity and rapid redress. That payment becomes a direct source of margin for carriers that invest in modern reefer fleets and monitoring technology.
Hazardous materials transport is another high-margin domain, albeit risk-heavy. Proper licensing, driver training, and insurance costs are high. But those costs also keep competitors out. Industrial shippers prefer stable partners for long-term contracts, which stabilizes revenue. Carriers specializing in hazmat often secure multi-year agreements with chemical producers, refineries, and waste management firms. Those contracts allow for predictable planning and return on safety-related investments.
Oversize and overweight moves are profitable because each load is complex and customized. Permitting, route planning, and escorts add direct billable services. Freight rates reflect the logistical effort and liability involved. While volumes are lower than general freight, the margins per move are substantial. Intensifying infrastructure constraints and urban route restrictions also raise the value of experienced carriers that can execute these moves reliably.
Expedited freight offers a slightly different economic model. Speed trades for price. When a shipper needs inventory moved urgently, the willingness to pay climbs steeply. Carriers that maintain teams and assets dedicated to same-day or next-day freight can charge these premiums and protect margins even when spot market rates fall.
The economics of specialization also improve firm survival. Firms that align with high-margin niches show lower failure rates and stronger long-term returns. Research indicates that alignment between service offerings and market demands — transactional alignment — is a core determinant of sustainability. When a carrier matches its capabilities with segments that reward those capabilities, it reduces exposure to commodity pricing swings. It locks in customers who value stability, compliance, and predictability.
Operational discipline is essential in these niches. Successful carriers track utilization tightly, manage maintenance to avoid downtime, and price contracts to include recovery for regulatory compliance and specialized labor. Technology plays a role too. Real-time tracking, temperature monitoring, and integrated documentation reduce disputes and justify higher rates. Investing in staff training and retention pays back through fewer incidents and better customer relationships.
Geography matters as well. Regional density near the border or in manufacturing hubs concentrates opportunity. Carriers that position assets where demand clusters have shorter turn times and lower repositioning costs. Conversely, firms that attempt to compete nationwide without specialization face diluted utilization and weaker bargaining power with shippers. The choice between scale and specialization is both strategic and practical.
Despite these opportunities, carriers in profitable segments are not immune to macro pressures. Rising fuel costs, labor shortages, and equipment scarcity affect margins. Trade policy and economic cycles can alter cross-border volumes. Even niche carriers must hedge against volatility with contract structures that include fuel adjustment clauses, minimum volume commitments, and pass-throughs for extraordinary regulatory changes.
For carriers considering a move into cross-border or niche freight, success requires a deliberate plan. Invest in the specific assets and certifications the market demands. Establish relationships with customs brokers and local partners. Price services to reflect the full cost of compliance and the value of reliability. Build redundancy to handle border delays or equipment outages. And treat customers as partners; long-term agreements reduce exposure to spot market swings.
The disparities between lanes and segments show why some carriers can be profitable while many are not. General freight faces relentless competition and thin margins. Cross-border Mexico trade and specialized freight create pockets where value is recognized and paid for. For operators willing to invest in those advantages, the market still offers paths to sustainable profitability.
For further detail on regional profitability patterns and operational efficiency trends in the U.S. trucking industry, see the Brookings analysis referenced in industry research: https://www.brookings.edu/research/us-trucking-industry-profitability-and-operational-efficiency-trends-2025/.
For practical guidance on handling cross-border complexity, consult this piece on navigating cross-border challenges for carriers: navigating cross-border challenges.
How Major Carriers Are Rewriting the Playbook to Find Profit in U.S. Trucking
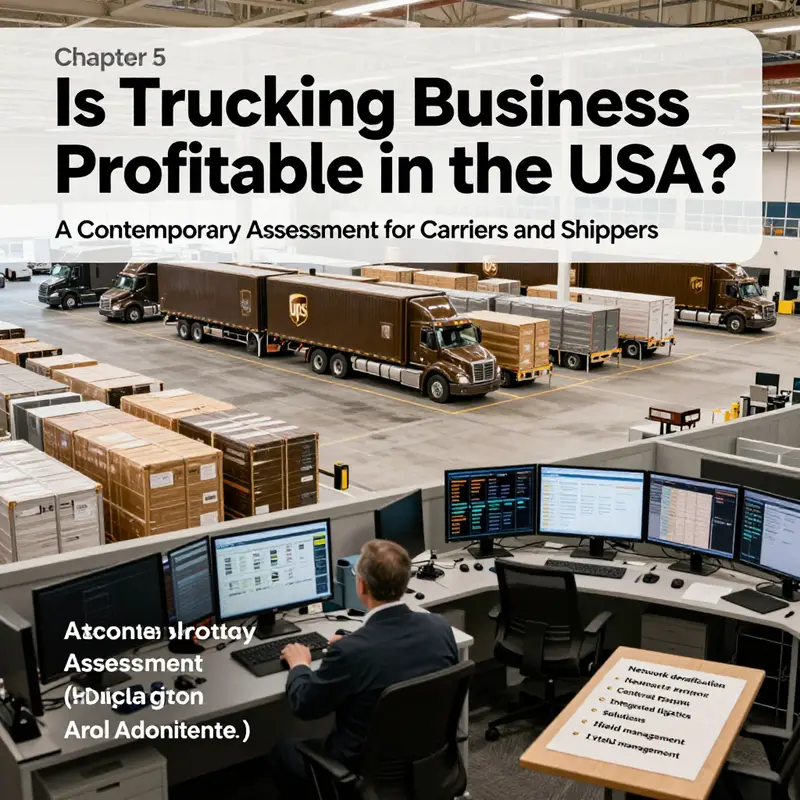
Strategic Adaptations by Major Carriers: Turning Data, Lanes, and People into Profit
The national trucking market remains strained, yet a handful of large carriers have begun to craft a new playbook for profitability. Rather than relying on short-term rate spikes or fleet expansion, these firms are reshaping network design, sharpening lane-level economics, and using advanced automation to squeeze margin from every mile. The shift is not a single tactic but a cohesive operating model that aligns technology, dedicated networks, and workforce strategies into one engine aimed at consistent returns.
At the heart of this transformation is a relentless focus on asset utilization. Large carriers are moving away from a one-size-fits-all approach and instead concentrate capacity where density and predictability reduce empty miles and increase revenue per truck. They design high-density corridors that feed frequent loads, consolidate smaller shipments into full loads through smarter pooling, and prioritize contract business with predictable schedules. The result: utilization rates that routinely exceed what the broader market achieves, shrinking the impact of the idle miles that have punished smaller operators.
Lane optimization is now a strategic function, not an operational afterthought. Carriers are cataloging lanes by margin, variability, and replacement cost. They then deploy capacity to lanes that deliver consistent, above-average yields or to those that serve strategic customers whose business supports network stability. This lane-level discipline limits exposure to volatile spot markets and allows carriers to bid selectively on contract work that fits their network. It also supports better pricing conversations with shippers: when a carrier can demonstrate the contribution margin of a lane, it gains leverage to negotiate rates that actually cover operating costs.
Technology is the glue that binds these initiatives. Beyond basic telematics and TMS systems, the most advanced carriers are implementing agentic AI—autonomous software agents that take end-to-end actions across planning, execution, and exception handling. These agents ingest market feeds, telematics, load boards, and historical performance to match loads, optimize routes in real time, and decide when to reposition tractors to harvest the next profitable load. The automation reduces planning lag and human error, and it responds to disruptions faster than traditional systems.
Predictive load matching is a clear example. Instead of reacting to posted loads, AI models forecast near-term demand in micro-markets and position capacity proactively. Predictive repositioning lowers empty miles, improves on-time performance, and reduces fuel and maintenance costs per loaded mile. When a truck is more likely to pick up a load on return, the carrier can sustain higher effective rates because the truck’s revenue-producing hours increase.
These gains compound when paired with dynamic dispatching. Sophisticated dispatch engines optimize for multiple objectives: minimizing empty miles, balancing driver hours-of-service, reducing dwell time at facilities, and honoring customer priorities. The result is a smoother day for drivers and a higher yield per asset for the company. Lower dwell and less idling also trim fuel burn and maintenance spend, shifting the P&L favorably.
But technology alone does not deliver sustainable profits. Organizational changes are essential. Leading carriers are reorganizing around lanes, customers, and outcomes rather than siloed product groups. This creates clear accountability for margin and ensures that pricing, operations, and sales work from the same data. When sales teams quote lanes, they use live margin models that reflect real-time fuel costs, empty-mile risk, and driver availability. This tight feedback loop prevents historically common mistakes where contracts were signed without operational viability.
Workforce strategy is another pillar. Recruiting and retention remain industry-wide challenges; large operators are treating drivers and planners as critical capital rather than variable costs. Investments in training, predictable schedules, and career pathways reduce turnover and amplify the benefits of technology. A stable driver pool means fewer disruptions and more consistent execution of optimized plans. Human capital investment is often the multiplier: technology boosts efficiency, but people sustain it.
Carriers are also carving out higher-margin niches. Dedicated contract carriage, specialized refrigerated lanes, and regulated pharmaceuticals are less susceptible to pure price competition. By aligning networks with customers who value reliability and precision, carriers capture premium pricing. Investment in specialized equipment and training solidifies that position, making the business less fungible and more defensible.
Seasonal planning and proactive capacity management play a role as well. Large carriers invest in predictive demand modeling months ahead of peak seasons and adjust capacity on a lane-by-lane basis. This avoids the rush-to-hire and the costly spot-market scramble that can erode margins. When capacity is scarce, carriers with pre-positioned assets and contractual commitments can command higher yields without the volatility seen in the broader market.
Another important strategic move has been tighter integration of cross-border trade lanes. Cross-border flows between the U.S. and Mexico remain more stable than some domestic lanes, and carriers that have built compliant, efficient cross-border operations enjoy consistent demand. Those businesses often pair cross-border expertise with customs brokerage and integrated documentation to reduce friction and turn time. The cumulative effect is steadier revenue through otherwise turbulent cycles.
Capital allocation decisions matter. Instead of chasing market share with fleet expansion, leading firms have selectively upgraded assets where returns justify the investment—high-efficiency tractors, aerodynamic trailers, and telematics that produce measurable fuel savings. They are also more disciplined about retirement cycles and maintenance strategies to prevent hidden cost inflation.
Regulatory and macro challenges complicate the picture. Tariff-led slowdowns and manufacturing softness have trimmed demand in specific sectors. But the carriers most likely to succeed are those that have diversified exposure across e-commerce-driven parcelization, regional distribution, and specialized segments that show resilience. That diversification, combined with a network-centric, tech-enabled operating model, helps smooth earnings.
Finally, these carriers emphasize transparency with customers. When shippers understand the true cost drivers—empty miles, dwell time, and expedited repositioning—they are more willing to engage in collaborative planning. Strategic partnerships yield better capacity utilization and a more stable rate environment.
The new playbook is not a guaranteed cure. Advanced technology and better planning reduce risk and cost, but they require investment, cultural change, and time to mature. For large carriers that commit, however, the shift creates a defensible advantage. It turns fleeting spot-market gains into sustained margin improvement by knitting together tighter networks, smarter dispatch, workforce stability, and selective asset investments.
For carriers of all sizes, the lesson is clear: profitability in the current U.S. trucking landscape is increasingly a function of orchestration. Those who can align lanes, people, and algorithms will be best positioned to escape the profitless recovery and earn returns that cover the true cost of moving freight.
For a deeper look at how agentic AI has been applied in practice by a major parcel carrier, see the company’s operational overview and results here: https://www.ups.com/newsroom/en-us/press-releases/2025/10-30-ups-agentic-ai-efficiency.html
For perspectives on rebuilding fleet management around people and skills, see this piece on transforming fleet management and investing in human capital: https://titanbusinesstrucks.com/transforming-fleet-management-the-case-for-investing-in-human-capital/
Final thoughts
Current market metrics indicate that for many U.S. carriers the trucking business is not broadly profitable. Spot-rate levels frequently fall short of fully allocated operating costs once empty miles, equipment finance, labor, and regulatory compliance are included. Structural factors — capacity contraction, tariff-driven demand softness, and market imbalance — flatten margins and increase volatility. Yet the industry is not uniformly bleak: cross-border Mexico lanes and specialized, high-value freight show resilience and higher yields, while large integrators demonstrate playbooks that improve returns through yield management, service differentiation, and network optimization. For logistics and freight firms, construction and engineering companies reliant on timely deliveries, fleet managers seeking cost control, and food & beverage distributors operating narrow-margin cold chains, the path forward requires disciplined cost accounting, targeted routing and contracting strategies, selective premium service offers, and investment in technology that reduces empty miles and improves utilization. By quantifying true break-even costs, prioritizing lanes with structural demand, and deploying proven commercial strategies, stakeholders can mitigate losses and identify pockets of profitable growth even in a challenging market.